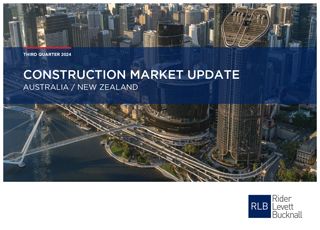
According to the Rider Levett Bucknall (RLB) 3rd Quarter 2024 Oceania Construction Market Update, the outlook for New Zealand’s construction industry remains weak in the near term.
Building activity indicators such as the New Zealand Institute of Economic Research (NZIER) Quarterly Survey of Business Opinion (QSBO) measure of architects’ work in their own office, along with consent issuance, point to a weak pipeline of construction for the coming year.
Lower interest rates and population growth expected to support recovery
Mr Steve Gracey, RLB Oceania Chairman said, “Beyond that, RLB expects the combination of lower interest rates and migration-led population growth to support a recovery in construction demand from 2025. Non-residential consent issuance has been mixed across the regions.”
“Demand has weakened across most regions over the past year, with Auckland being the exception. Stronger demand for the construction of industrial and storage facilities has driven the growth in non-residential consent issuance in Auckland over the past year,” he added.
Demand for industrial buildings to slow over coming year
According to the RLB Report, the continued contraction in manufacturing activity reported in the June 2024 Business NZ Performance of Manufacturing Index (PMI) suggests that demand for industrial buildings will slow over the coming year.
With manufacturing activity reported to be particularly weak in the North Island, RLB expects this will impact construction demand for industrial buildings in Auckland.
Mr Gracey continued, “The $12.7 billion increase in the value of infrastructure projects in the pipeline over the March quarter reflects a combination of new infrastructure projects (worth $11.4 billion), increases in the value of existing projects, and new contributors to the pipeline.”
Infrastructure in transport, social and water sector to dominate pipeline
“Transport infrastructure continues to be a dominant part of the pipeline, with the value of transport projects totalling $61.9 billion,” he noted.
Meanwhile, in terms of projected spend over the coming years, $12.1 billion of infrastructure investment from the pipeline is expected to take place in 2024, while expectations for infrastructure investment for 2025 remain at $11.6 billion.
Over the near term, infrastructure investment in the transport, social (including community facilities and housing) and water sectors is expected to dominate the pipeline.
Signs economy slowly emerging from technical recession
This pickup in activity follows contractions in the previous two quarters, effectively ending the technical recession. The result suggests the economy may be slowly emerging from the recent weakness, but recovery remains fragile and uneven across sectors.
Weak demand is still broad-based across the sectors, reflecting the headwinds faced by households and businesses in the current environment of high interest rates and heightened uncertainty. The value of water infrastructure in the pipeline totalled $20.6 billion.
Auckland main driver of construction activity due to migration
There was a decline in construction activity across the regions. Auckland remains the dominant driver of construction activity, making up around 40% of nationwide construction activity (on a nominal basis). This reflects the continued concentration of migration-led population growth in the region.
Meanwhile, Waikato’s share of nationwide construction activity has eased in recent quarters and currently makes up 9% of nationwide construction activity. Building activity indicators point to continued weakness in the construction pipeline in the near term. Dwelling consent issuance has continued to decline in recent months, with a reduction in demand across all types of dwellings since the beginning of the year.
Weak demand putting downward pressure on prices
The annual number of dwelling consents issued eased below 35,000 for the year to May 2024. Cost pressures have reduced in the construction sector, and the weak demand environment is putting downward pressure on prices. This suggests further easing in construction cost inflation over the coming year.
RLB TENDER PRICE INDEX ANNUAL % UPLIFTS AS AT Q3 2024
| New Zealand | 2023 | 2024 f | 2025 f | 2026 f | 2027 f | 2028 f |
|---|---|---|---|---|---|---|
| Auckland | 5.5 | 0.0 | 2.7 | 3.0 | 3.3 | 4.5 |
| Christchurch | 5.0 | 2.0 | 2.0 | 3.0 | 3.0 | 3.0 |
| Wellington | 5.0 | 3.0 | 3.0 | 3.0 | 3.0 | 2.5 |
FURTHER INFORMATION:


