Non-residential crane numbers across Australia have hit a new peak (370 cranes) according to the 25th edition of the RLB Crane Index®, as the large amount of civil and infrastructure projects impact the construction industry.
Mr Domenic Schiafone, the Rider Levett Bucknall (RLB) Oceania Director of Research and Development said,” Construction crane numbers remain strong across Australia led by Sydney, Melbourne and the Gold Coast.”
“The Australian construction industry remains buoyant, with 863 cranes on sites nationally. The Q3 2024 RLB Crane Index® has recorded the third highest count in the 25 editions of the index. The index has recorded more than 800 cranes nationally for the past six editions,” he added.
Since the inaugural RLB Crane Index® was released in October 2012, and now proudly in its 25th edition, the index continues to provide valuable insights into the Australian construction industry.
Construction activity is up as Sydney leads the way
The large number of cranes observed correlates with national construction activity. According to the Australian Bureau of Statistics, construction activity within Australia was up 2.2% (or $3.3b) in the first six months of 2024 compared to the same period last year. Residential activity across the country is down slightly for the first six months of 2024 compared to the corresponding period in 2023.
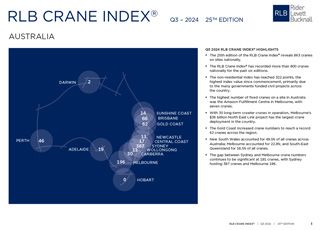
Looking around the country, Sydney continues to be the main driver of crane activity. Of the 863 cranes sighted across Australia, 387 were in Sydney, 196 were in Melbourne, 66 were in Brisbane, 62 on the Gold Coast, 46 were in Perth, 30 were in Canberra, 19 in Adelaide, 14 were on the Sunshine Coast, 13 in Newcastle, 12 on the Central Coast, 11 in Wollongong, 2 in Darwin and in Hobart.
Nearly half of all crane numbers across the country in NSW
New South Wales accounted for 49.5% of all cranes across Australia; Melbourne accounted for 22.8%; and South-East Queensland for 16.5% of all cranes. The gap between Sydney and Melbourne crane numbers continues to be significant at 191 cranes, with Sydney hosting 387 cranes and Melbourne 196.
Despite a slight dip to 863 cranes from 882 cranes six months ago, crane numbers across the country remain high. In the last six months, 257 new cranes were added to new projects, and 263 cranes were removed from projects nearing completion.
Civil and engineering sector continues strong growth
Non-residential activity slightly exceeded 2023 results with the civil and engineering sector continuing its substantial growth. In the 2023 calendar year, engineering activity grew by 16% and has continued to grow by 6% for the first six months of 2024.
There are 370 cranes on non-residential sites: an increase of 36 cranes over the past six months.
There are currently 493 residential cranes on sites around the county (57% of all cranes), down from 535 in the last count. Only 134 cranes were added to residential projects, with 176 removed from sites.
The Gold Coast increased crane numbers to reach a record 62 cranes across the region.
Brisbane recorded the largest volume of changes in crane numbers, with a decrease of more than ten cranes. Nationally, seven cities experienced a rise in cranes (Adelaide, Canberra, Central Coast, Darwin. Gold Coast, Melbourne, and Perth), while five cities recorded lower crane numbers for Q3 2024 (Hobart, Newcastle, Sunshine Coast, Sydney, and Wollongong).
Sydney’s west overtakes the north in crane numbers
Across Sydney’s five main regions, only the west experienced significant growth in crane numbers. The other four regions saw a decline. The west saw an increase in crane activity, with a total of 108 cranes, accounting for 28% of all cranes in Sydney. The north, which previously had the highest concentration of cranes, remained relatively stable. Over the past six months, the CBD and surrounds saw a 7% reduction (six cranes), the south an 11% reduction (six cranes), and the east an 8% reduction (four cranes).
The projects with the largest number of cranes in Sydney include: Viciniti & Destination (Macquarie Park, five cranes), Western Sydney Airport (Badgery’s Creek, four cranes), new Sydney Fish Markets (Glebe, four cranes), Powerhouse Parramatta (Parramatta, four cranes), Mamre Road Precinct (Kemps Creek, four cranes) and Marsden Park (four cranes).
With 30 long-term crawler cranes in operation, Melbourne’s $36 billion North East Link project has the largest crane deployment in the country. The residential sector currently accounts for 41% of all cranes in Melbourne with 80 cranes, while the civil sector accounts for 24% of Melbourne’s cranes with 47.
| Number of Cranes | 20th Ed Q1 2022 | 21st Ed Q3 2022 | 22nd Ed Q1 2023 | 23rd Ed Q3 2023 | 24th Ed Q1 2024 | 25th Ed Q3 2024 |
|---|---|---|---|---|---|---|
| Adelaide | 16 | 17 | 18 | 17 | 17 | 19 |
| Brisbane | 79 | 82 | 77 | 85 | 78 | 66 |
| Canberra | 31 | 23 | 17 | 21 | 26 | 30 |
| Central Coast | 10 | 10 | 13 | 15 | 12 | 17 |
| Darwin | 2 | 2 | 4 | 3 | 0 | 2 |
| Gold Coast | 40 | 52 | 56 | 61 | 61 | 62 |
| Hobart | 0 | 2 | 1 | 1 | 2 | 0 |
| Melbourne | 192 | 206 | 189 | 178 | 194 | 196 |
| Newcastle | 12 | 12 | 9 | 15 | 16 | 13 |
| Perth | 55 | 51 | 51 | 50 | 45 | 46 |
| Sunshine Coast | 16 | 16 | 20 | 22 | 16 | 14 |
| Sydney | 384 | 380 | 365 | 401 | 390 | 387 |
| Wollongong | 12 | 15 | 16 | 13 | 12 | 11 |
Click here to read the full Q3 2024 Australian RLB Crane Index®
FURTHER INFORMATION: