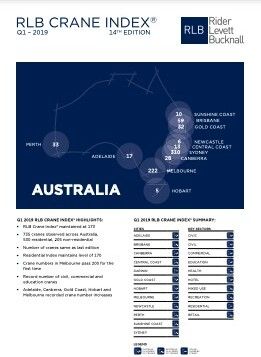
According to the Rider Levett Bucknall Q1 2019 RLB Crane Index® Melbourne continues to surge with an increase of 30 net cranes during the past six months, to reach a new peak of 222. Across Melbourne, 105 cranes were added to projects and 75 were removed.
Since the March 2018 edition, the Victorian capital has undergone a significant 40% increase in the number of cranes standing tall across its’ CBD and suburbs.
Sydney residential sector shows gradual decline
Sydney meanwhile, with 310 cranes, has experienced an almost 10% drop in cranes since the RLB Crane Index® March 2018 edition and a net decrease of eleven cranes during the past six months, driven by the declining residential sector.
Domenic Schiafone, RLB’s Oceania Director of Research and Development said, ‘While Australia’s record 735 long-term cranes from our previous edition remains unchanged, we are seeing strong resilience in many markets and sectors across the country.’
Current economic conditions may hamper future developments
We have seen a record number of cranes used in the civil (29), commercial (67) and education (17) sectors, whilst the residential sector showed a small increase to 530 cranes across Australia (representing 72% of all cranes erected).
‘But the future commencement of many developments could be affected by the current economic conditions impacting the property industry, such as tightening finance availability, falling foreign investment and general market confidence,’ he continued.
Sydney still leads overall crane count
According to the RLB Crane Index®, Sydney continues to be the main driver of the crane count. Of the 735 cranes sighted across Australia, 310 were in Sydney, 222 were in Melbourne, 59 were in Brisbane, 33 were in Perth, 32 were on the Gold Coast, 28 were in Canberra, 17 in Adelaide, 10 in the Sunshine Coast, 6 were in Newcastle and 5 were in Hobart.
Victoria going strong
Solidifying the strength of the Victorian construction industry, construction work done rose 15% by chain volume terms for CY 2018, with increases recorded for all sectors. The residential and non-residential building sectors increased 9.1% and 9.5% respectively.
Melbourne’s crane numbers surged past 200 for the first time, with an additional 30 cranes observed for this edition. This increase was driven by the addition of new cranes to existing large sites.
Melbourne’s largest building site, M-City in Clayton recently went from two cranes to six. Malaysian Developer OSK Property’s $2.8 billion Melbourne Square currently has four cranes onsite and Lend Lease’s Melbourne Quarter has five.
NSW construction work continues to grow despite Sydney drop
In Sydney, crane numbers declined by eleven, lowering the crane count from 321 to 310. 175 cranes were added and 186 removed. Despite the small drop in cranes, NSW construction work done continued to grow, up 9.0% in chain volume terms for CY 2018. Engineering work rose 12%, while residential and non-residential work increased 6.3% and 8.9% respectively.
Twelve new civil cranes were erected in St Peters for WestConnex and two in North Sydney for the Sydney Metro project, with ten removed from projects in Ashfield, Balmoral, Bella Vista, Hornsby, Kingsgrove, North Sydney and Pendle Hill.
Gold Coast cranes rising as Brisbane sees biggest decline
Brisbane suffered the biggest decline with a decrease of 13 cranes, resulting in 59 cranes standing opposed to 72 six months ago. Inner Brisbane accounted for the eight dismantled cranes, driven by the mixed use sector. Cranes were removed from Howard Smith Wharves, 949 Ann Street, Queens Wharf and South City Square.
The Gold Coast RLB Crane Index® continued its upward trajectory, recording a 33% increase to 213. The residential sector accounts for 94% of all Gold Coast cranes, falling slightly from the previous edition. The sector saw 17 cranes placed on sites and 10 removed, bringing the sector count to 30 in total.
For further details in each Australian city, please refer to the Q1 2019 RLB Crane Index.
FURTHER INFORMATION:


