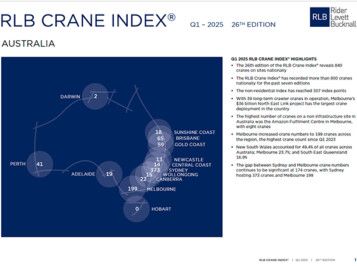
The Australian construction sector continues to shine, with 840 cranes reported nationwide during March 2025, according to the 26th edition of the RLB Crane Index®.
Ewen McDonald, Rider Levett Bucknall’s Oceania Director of Research and Development, commented: “Construction crane numbers remain strong across Australia, driven by capital cities such as Sydney, Melbourne, and Brisbane.”
“Over the last six editions of the RLB Crane Index®, crane numbers have consistently remained above 800 nationally,” he added.
Tracking industry health since 2012
Since its inception in October 2012, the RLB Crane Index® has provided invaluable insights into the Australian construction landscape, helping industry stakeholders make informed decisions. Now in its 26th edition, the Index is vital in tracking the industry’s health.
There is a slight dip in the index, but activity remains high
The RLB Crane Index® experienced a slight dip of six points, reaching 197 points in Q1 2025, corresponding to 840 cranes nationwide. This is down from a record high of 882 cranes recorded in Q3 2023, 18 months ago.
Over the past six months, 290 new cranes have been added to construction projects, while 313 cranes have been removed as buildings near completion.
Sydney leads the nation in crane numbers
Sydney continues to lead the crane count in Australia. Of the 840 cranes nationwide, 373 are in Sydney, followed by 199 in Melbourne, 65 in Brisbane, and 59 on the Gold Coast. Other counts include:
- 41 in Perth
- 22 in Canberra
- 19 in Adelaide
- 18 on the Sunshine Coast
- 15 in Wollongong
- 14 on the Central Coast
- 13 in Newcastle
- 2 in Darwin
- 0 in Hobart
Construction growth backed by ABS data
Ewen continued, “The increase in crane activity aligns with broader construction growth across Australia. According to the Australian Bureau of Statistics, total construction activity in 2024 rose by 2.7%, or $7.6 billion, compared to 2023.”
“Residential construction saw a 2.7% increase, while non-residential construction experienced a slight decline. The civil engineering sector, however, showed robust growth with a 5.8% increase,” he said.
Residential vs non-residential sector trends
Regarding sector-specific data, the Residential Crane Index fell slightly from 159 to 157 points, reflecting a decrease from 492 to 487 cranes. Despite this, 174 cranes were added to residential projects, while 179 were removed. The Non-Residential Index also declined, dropping to 307 points and reflecting a decrease of 17 cranes—now representing 42% of the national crane count, down from 43%.
City-by-city shifts in crane counts
According to RLB, Sydney saw the largest reduction in crane numbers, with a drop of 14 cranes. In contrast, three cities – Melbourne, Sunshine Coast and Wollongong – experienced increases, while five cities saw declines.
Sectoral trends highlight emerging and declining areas
Sectoral trends from Q3 2024 to Q1 2025 reveal significant growth in the data centre and mixed-use sectors. Conversely, the education, commercial, and civil sectors have notably declined. Residential construction experienced more moderate changes with 174 new cranes commencing on projects and 179 removed in the six months.
Melbourne project sites set national records
Ewen concluded, “The highest concentration of tower cranes on a single non-infrastructure site was found at the Amazon Fulfillment Centre in Melbourne, where eight cranes operate. Additionally, Melbourne’s $36 billion North East Link project boasts the largest crane deployment in the country, with 39 long-term crawler cranes in operation,” he said.
| Number of Cranes | 21st Ed Q3 2022 | 22nd Ed Q1 2023 | 23rd Ed Q3 2023 | 24th Ed Q1 2024 | 25th Ed Q3 2024 | 26th Ed Q1 2025 |
|---|---|---|---|---|---|---|
| Adelaide | 17 | 18 | 17 | 17 | 19 | 19 |
| Brisbane | 82 | 77 | 85 | 78 | 66 | 65 |
| Canberra | 23 | 17 | 21 | 26 | 30 | 22 |
| Central Coast | 10 | 13 | 15 | 12 | 17 | 14 |
| Darwin | 2 | 4 | 3 | 0 | 2 | 2 |
| Gold Coast | 52 | 56 | 61 | 61 | 62 | 59 |
| Hobart | 2 | 1 | 1 | 2 | 0 | 0 |
| Melbourne | 206 | 189 | 178 | 194 | 196 | 199 |
| Newcastle | 12 | 9 | 15 | 16 | 13 | 13 |
| Perth | 51 | 51 | 50 | 45 | 46 | 41 |
| Sunshine Coast | 16 | 20 | 22 | 16 | 14 | 18 |
| Sydney | 380 | 365 | 401 | 390 | 387 | 373 |
| Wollongong | 15 | 16 | 13 | 12 | 11 | 15 |
| AUSTRALIA | 868 | 836 | 882 | 869 | 863 | 840 |
FURTHER INFORMATION:


