The latest quarterly cost report (QCR) charts construction trends in 16 cities throughout North America (formerly 14; Miami and Nashville have been newly added). The latest report indicates that construction costs are slowing down.
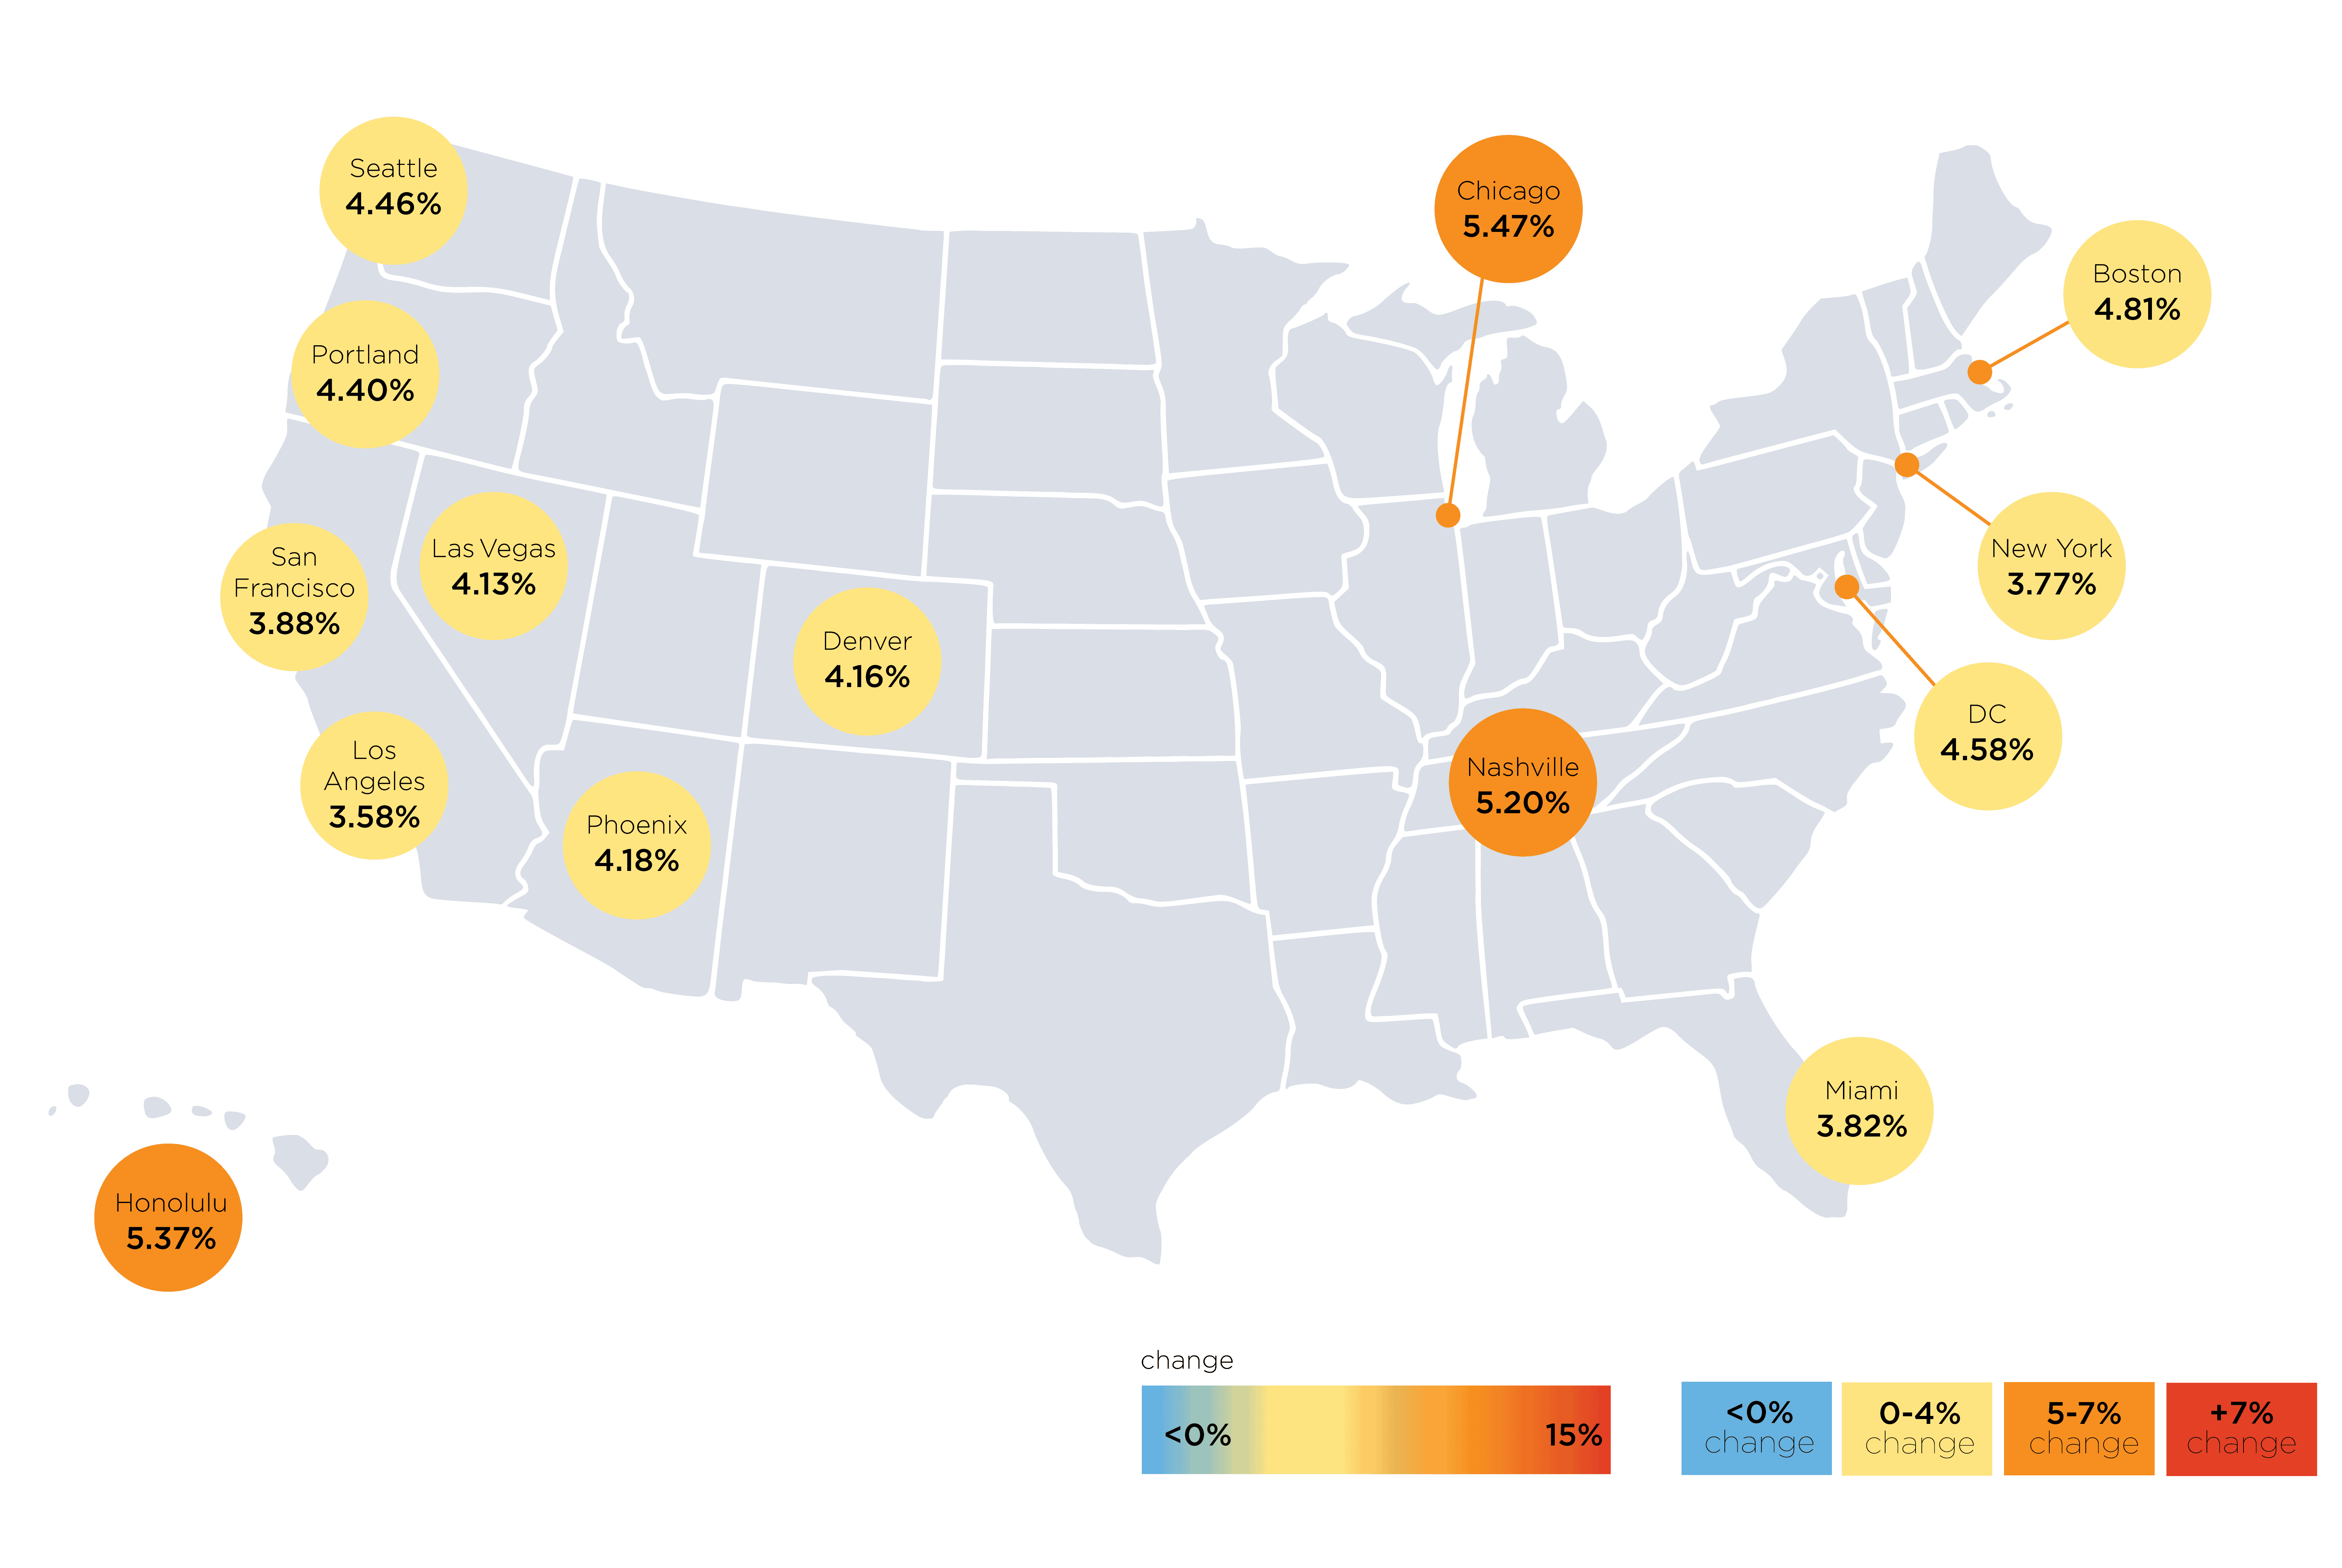
With data current to mid-Q1 2025, shows that the national average change in construction costs was 0.98% in Q1, which was down from 1.11% in Q4; congruently, the year-over-year rate is 4.35%, down from 5.86% this time last year. Boston, Chicago, Honolulu, Portland, and Seattle experienced increases in construction costs over the national average this quarter, while Denver, Las Vegas, Los Angeles, Nashville, Miami, Phoenix, San Francisco, and Washington D.C. experienced gains that were less than the national average.
“While the media focuses on potential tariff wars and inflation spikes, our research presents a clearer, more measured view. Economic shifts have yet to significantly impact construction and project costs, and though broader factors may eventually play a role, I feel the true challenge is rising labor costs. We will continue to rely on careful analysis based on reliable data to guide successful decision-making. I am confident in the industry’s resiliency; challenges will arise, and we will adapt.”
Paul Brussow, President of RLB North America
A Few Key Insights:
- The U.S. national average increase in construction cost is approximately 0.98 percent in Q1, compared to 1.11 percent in Q4
- The construction unemployment rate is 5.4 percent, down from 5.7 percent during the same period last year
- The Architectural Billings Index (ABI) in January was 45.6, a slight increase from 44.6 in December
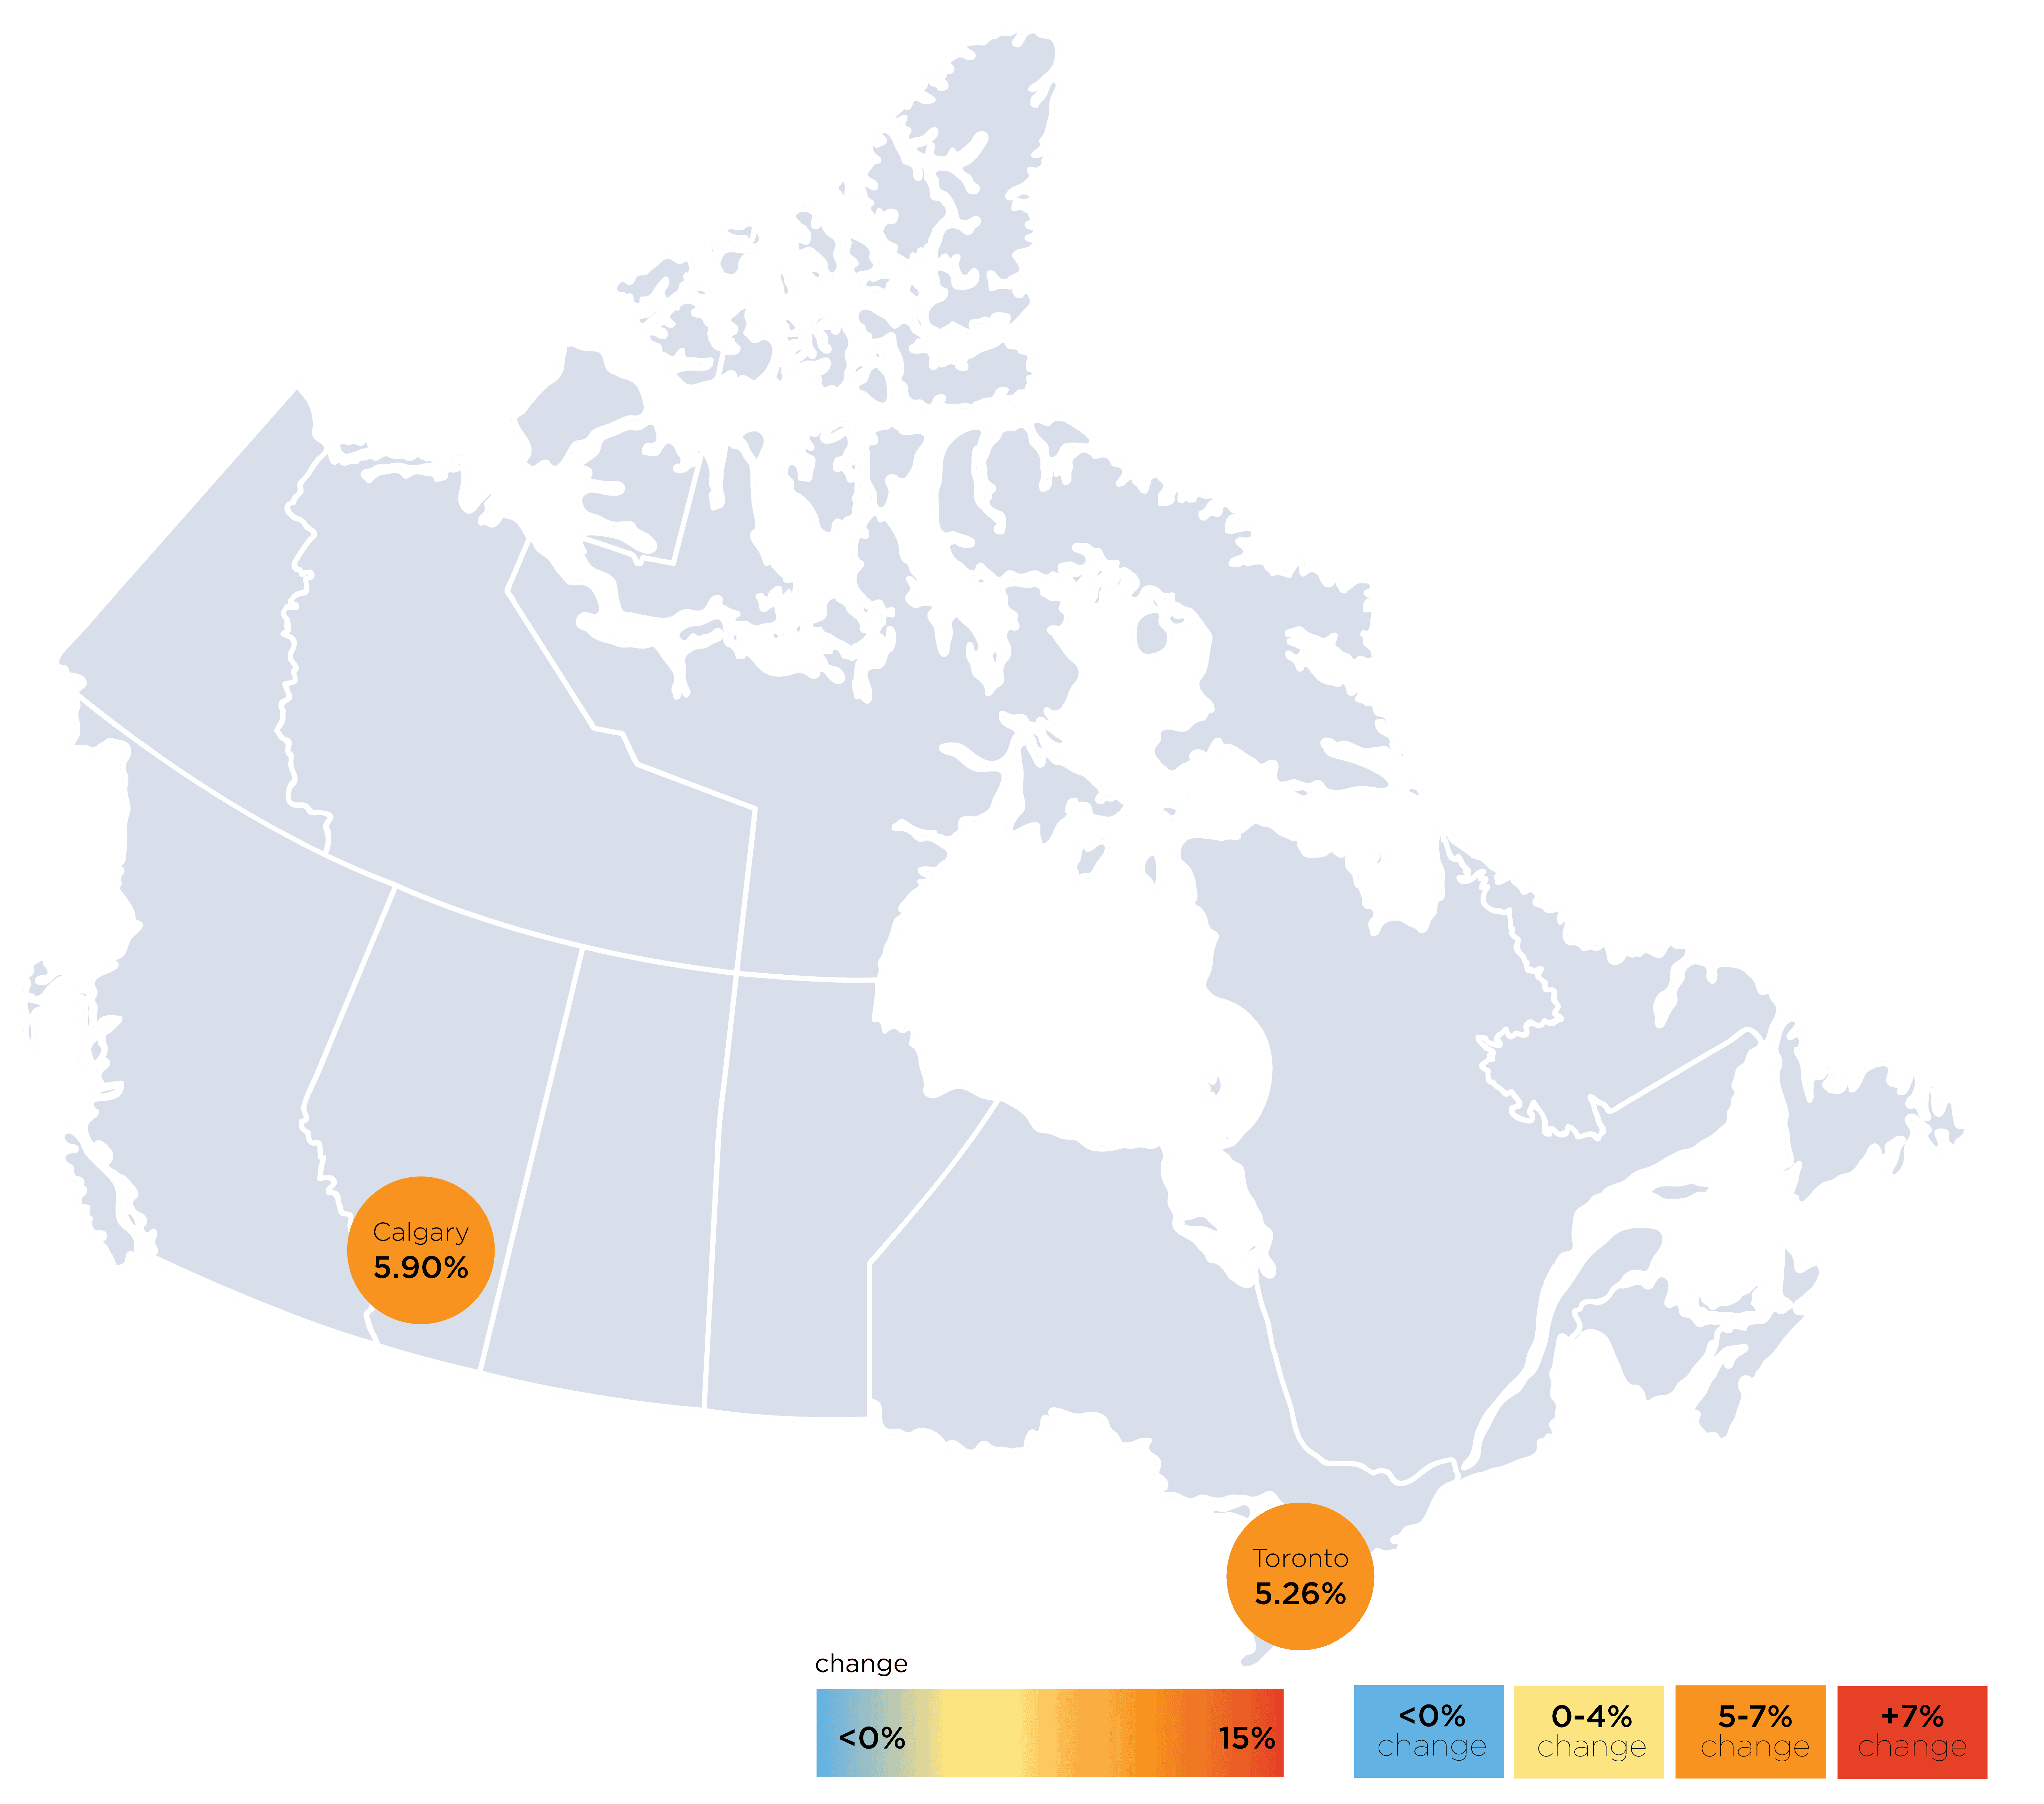
The first chart (below) shows a comparative map of the annual percentage change for the U.S.; the second chart shows the same comparative map for Canada.


FURTHER INFORMATION:


